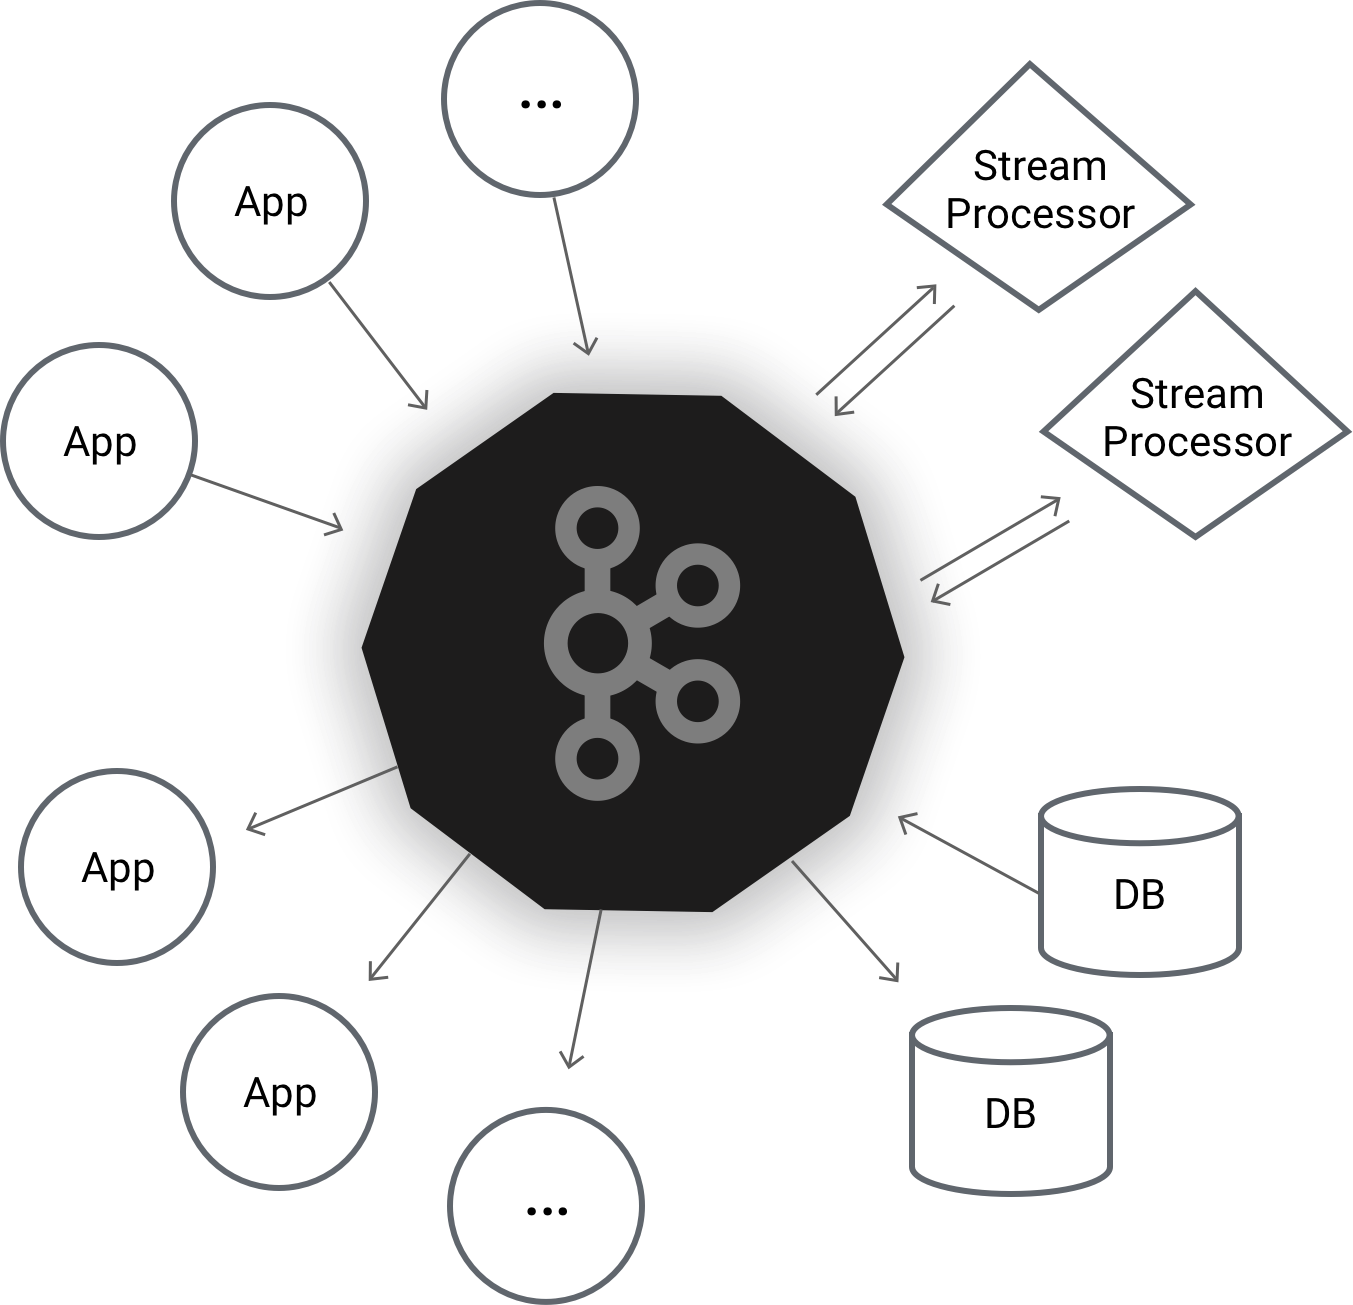
Kafka clusters provide a number of opportunities for monitoring. At the network level, you can monitor connections between Kafka nodes, Zookeeper, and clients. At the host level, you can monitor Kafka resource usage, such as CPU, memory and disk usage. And Kafka itself provides log files, an API to query offsets, and JMX support to monitor internal process metrics.
In this blog post, the first in a series that show you how to use Beats for monitoring a Kafka cluster, we’ll focus on collecting and parsing Kafka logs by using Filebeat and Elasticsearch Ingest Node. After indexing the Kafka logs into Elasticsearch, we’ll finish this post by building Kibana dashboards for visualizing the data.
This blog post is based on The Elastic Stack version 5.1.1. All configuration files, dashboards and sample log files can be found on GitHub.
Cluster Setup


