Kibana, being the ‘K’ in ‘ELK’, is the amazing visualization powerhouse of the ELK Stack.
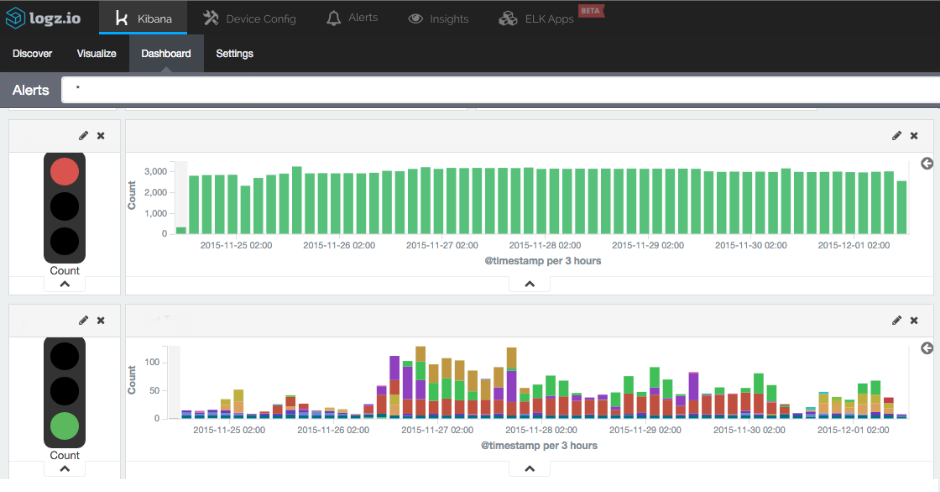
We use the software to create nice dashboards that display metrics including page visits, server JVM performance, messages from our client-side application, and technical SEO data.
Kibana is great at creating these visualizations with a useful plugin infrastructure that allows users to extend Kibana’s capabilities to create many different custom visualizations.
In this tutorial, I will demonstrate how we extended Kibana to add a “traffic light” visualization to the software’s features. This will be very similar to the “metric” visualization but designed to work as a traffic light. Green is for a metric that is “good”; red is for a metric that is “bad.” (The background: Our devops team had been looking for a simple and intuitive way to visualize “good versus bad,” so I decided to add a stoplight for our NOC team.)
Read the complete article here.


