Partner links

How to layout and design an infographic in R

Infographic in R

For R fans and infographics lovers out there (I’m one of you), here’s an article that shows how to layout and design an infographic in R.

Here’s how the data used to generate it was obtained.

y1 <- round(rnorm(n = 36, mean = 7, sd = 2)) # Simulate data from normal distribution
y2 <- round(rnorm(n = 36, mean = 21, sd = 6))
y3 <- round(rnorm(n = 36, mean = 50, sd = 8))
x <- rep(LETTERS[1:12], 3)
grp <- rep(c("Grp 1", "Grp 2", "Grp 3"), each = 12)
dat <- data.frame(grp, x, y1, y2, y3) 

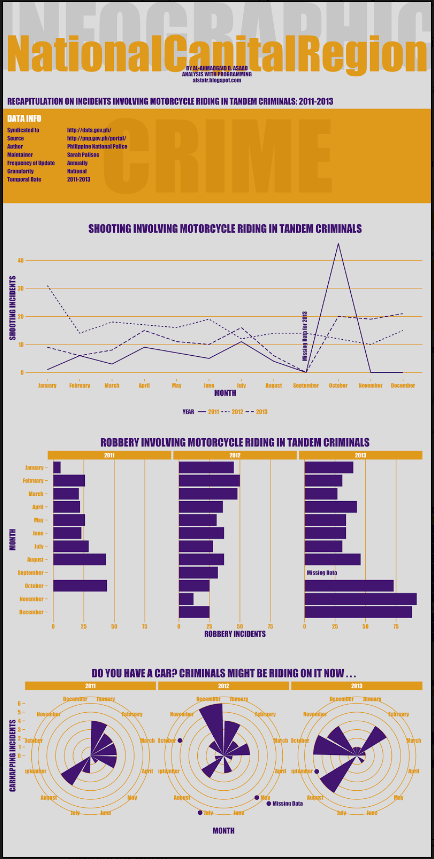
Below is the final product. Go here to learn how the author did it.
Infographic in R

Share:

Facebook
Twitter
Pinterest
LinkedIn

Partner links

Newsletter: Subscribe for updates

Subscribe
Notify of
guest
0 Comments
Inline Feedbacks
View all comments

Get the latest

On social media

Security distros

Hacker
Linux distros for hacking and pentesting

Crypto mining OS

Bitcoin
Distros for mining bitcoin and other cryptocurrencies

Crypto hardware

MSI GeForce GTX 1070
Installing Nvidia GTX 1070 GPU drivers on Ubuntu

Disk guide

LVM
Beginner's guide to disks & disk partitions in Linux

Bash guide

Bash shell terminal
How to set the PATH variable in Bash
Categories
Archives
0
Hya, what do you think? Please comment.x
()
x