The official Elasticsearch Image on Docker Hub has already generated more than 1.6 million pulls. It is probably the easiest way to get a development setup — which includes Elasticsearch — to the application stack.
The reason for this crazy number?
A rapidly growing number of organizations are using Elasticsearch and Docker in production. Needless to say, monitoring Elasticsearch is essential in production, and you can find a detailed analysis of this topic (including the “top 10 Elasticsearch metrics to watch”) in the free eBook: ElasticsearchMonitoring Essentials.
Docker is disruptive in many ways, and there are many things that are slightly different and worth mentioning. These include:
- Changed deployment for Elasticsearch and its monitoring tools using Dockerfile, Docker Compose or various Orchestration Tools.
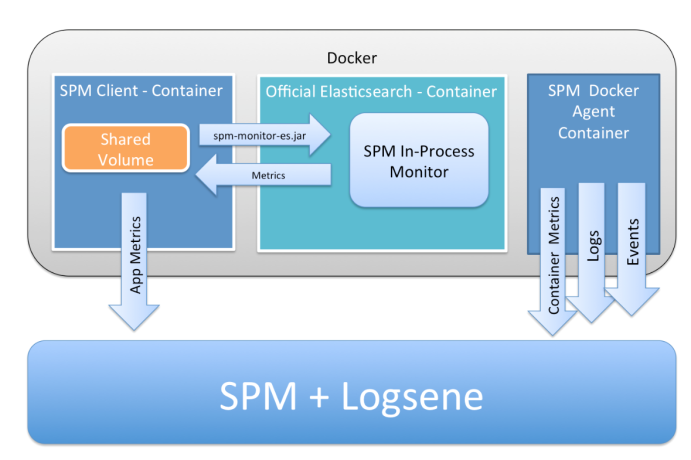
- There is a new Layer to monitor: Container Metrics and Events, see: Docker Events and Metrics monitoring and SPM for Docker.
- Logging has changed: containers log to the console and logs needs to be retrieved from Docker-Daemon instead getting them from the Elasticsearch log file. Check out our post on the subject: Innovative Docker Log Management.
- Official Images may not provide options for monitoring (such as JMX). However, the official Image for Elasticsearch provides an option to pass parameters to the Java Runtime Environment. We we will use this option for Elasticsearch monitoring in this post. You should also be aware that the official Elasticsearch Image does not include any plugins, and commercial monitoring from Elastic can’t be distributed in this Image for licensing reasons. Our monitoring tool of choice is SPM. If you are not familiar with SPM — but have heard of it — or if you use Marvel, have a look at Marvel vs. SPM.
Next, I’m going to demonstrate a setup to monitor multiple Elasticsearch nodes on a single Docker Host. The final setup will provide the full Monitoring and Logging package: Continue reading.


